The third quarter of 2026 closed on Phuket with an unusual combination: tourist arrivals fell 1.76 percent, southern Thailand housing prices rose faster than in any other region of the country, and the flow of new supply in our catalogue contracted 26 percent. Below is the structure of the market across 13 districts and property types, a like for like yield calculation, and an explanation of why the island average price misleads buyers.
The report is built on the InDreams Phuket catalogue: 831 properties for sale as of 30 September. More than half of them are in Bang Tao and Laguna, where our office and core expertise are, so the sample there is the most complete. External tourism and price data are linked to their sources.
Eight numbers that define Q3 2026
- 831 properties were available to buy as of 30 September 2026, a further 1,303 in the sale database are an archive of closed deals used for price analytics.
- THB 21,640,500 (about USD 618,000) is the median price of an active property.
- THB 34,390,278 (about USD 983,000) is the average. It sits 59 percent above the median, and that gap is the key to this entire report.
- 102 new properties entered our catalogue during the quarter, against 137 in Q2. New supply flow fell 26 percent.
- 58 percent of the catalogue’s active supply is in Bang Tao and Laguna, 486 of 831 properties. It is our home district, and it also has the deepest rental market on the island.
- 3.11 times is the price per square metre gap between Patong (THB 170,416) and Chalong (THB 54,878) on an island 50 kilometres long.
- 32 properties out of 831 carry a guaranteed yield promise: 4 percent of supply, not the standard practice advertising suggests.
- Minus 1.76 percent tourist arrivals in January to August against a 5.59 percent year on year rise in the southern Thailand price index: the housing market has decoupled from tourist flow.

How many Phuket properties are actually available to buy
The first thing to understand about the Phuket market: the listing count shown by catalogues and aggregators and the number of properties you can actually buy differ by a wide margin.
A sold property is not deleted from our database: it stays flagged as sold, together with its description, floor plan and price history. This archive of deals is what market analytics and comparable matching are built on. It can no longer be bought, and the catalogue marks it as sold.
In numbers, as of 30 September 2026:
| Metric | Value |
|---|---|
| Listings in the sale section | 2,134 |
| Of which flagged sold | 1,303 |
| Share sold | 61 percent |
| Available to buy | 831 |
Of 2,134 properties in the sale database, 831 are available now and the other 1,303 are the sold archive. Genuine choice on the island is 2.6 times narrower than the headline listing counts in catalogues and aggregators suggest.
For buyers this is the key correction. At 2,134 the island looks oversupplied and the instinct to wait for a price correction looks rational. At 831 supply is tight, and waiting costs you choice rather than earning you a discount.
The practical rule when working with any Phuket catalogue or aggregator: request the current status of each property and do not judge market depth by the number of cards in a search result.
Figures throughout this report are presented in two modes. Quarter on quarter trends use all published listings, without which the comparison would be meaningless. Current market conditions use active supply only. Every table is labelled.
What changed over the quarter: like for like comparison
Both columns use the same basis: all published listings, including sold ones. That keeps catalogue dynamics comparable.
| Metric | Q2 2026 | Q3 2026 | Change |
|---|---|---|---|
| Total listings in database | 3,367 | 3,487 | +3.6% |
| Sale section | 2,066 | 2,134 | +3.3% |
| Rental section | 1,301 | 1,353 | +4.0% |
| Average sale price, USD | 797,143 | 800,963 | +0.5% |
| Villas: listings | 1,104 | 1,136 | +2.9% |
| Villas: average price, USD | 1,070,000 | 1,080,708 | +1.0% |
| Apartments: listings | 893 | 925 | +3.6% |
| Apartments: average price, USD | 387,000 | 385,076 | -0.5% |
| Penthouses: average price, USD | 1,570,000 | 1,536,496 | -2.1% |
| Bang Tao and Laguna: properties | 1,760 | 1,834 | +4.2% |
| Three bedroom layouts | 953 | 970 | +1.8% |
| Band below USD 200K | 391 | 406 | +3.8% |
| Band above USD 1M | 473 | 494 | +4.4% |
The headline reads as moderate database growth of 3.6 percent against nearly static prices: plus 0.5 percent island wide. What matters more is that the growth is almost entirely on paper. It comes not from new supply but from the accumulation of sold listings that remain in the catalogue. The flow of genuinely new properties contracted over the same period.
Price stability in dollar terms deserves separate note. The average sale price moved half a percentage point in a quarter. For a market the media describes as booming, that is very calm. The growth being reported sits mainly in land and in specific premium locations, not in the typical property.
New supply flow fell 26 percent
This is the substantive news of the quarter. July, August and September added 102 new properties to the database. April, May and June added 137.
| Period | New properties |
|---|---|
| Q2 2026 | 137 |
| Q3 2026 | 102 |
| Change | -26 percent |
By type, Q3 new supply broke down as 60 villas, 41 apartments and 1 penthouse. A further 310 existing listings were updated or revised, and 34 properties were flagged sold.
One detail matters: 55 of the 102 new properties landed in Bang Tao and Laguna. That means 54 percent of new supply appeared in a district that already holds 58 percent of the catalogue. Outside Bang Tao the catalogue barely moved: Rawai, Nai Yang, Nai Harn, Chalong, Karon and Mai Khao added no new properties at all during the quarter.
For buyers this has a concrete implication. If you are choosing between districts, your options outside Bang Tao are narrowing, and they are narrowing not because everything sold but because new projects are not going there. Developers are concentrating capital in an already crowded location.
Why the Phuket average price misleads
The average active property costs THB 34.4 million. The median costs THB 21.6 million. The average sits 59 percent higher.
The median is the price of the property exactly in the middle of the list: half cost more, half cost less. The average adds every price and divides by the count, so a handful of trophy villas at THB 200 to 300 million lifts it for everyone.
The practical takeaway: when an article or advertisement tells you "the average Phuket property costs around a million dollars," that is not a description of what a million dollars buys. The typical property on the island costs USD 618,000, and at that level it is already a villa or spacious apartment. The gap between those two numbers is budget buyers wrongly assume is mandatory.
| Price band | Properties | Share of active market |
|---|---|---|
| Below THB 5M | 71 | 8.5% |
| THB 5-10M | 164 | 19.7% |
| THB 10-20M | 173 | 20.8% |
| THB 20-50M | 278 | 33.5% |
| Above THB 50M | 145 | 17.4% |
More than a quarter of the active market, 235 properties, costs up to THB 10 million, roughly USD 286,000. The entry threshold to Phuket is considerably lower than the luxury narrative implies, though choice in that segment is limited: it is mostly one and two bedroom apartments rather than villas.
Districts: a 3.11 times gap in price per square metre
This table covers active supply in the InDreams Phuket catalogue only. Districts with at least 8 available properties are included.
| District | Active | New in Q3 | Median, THB | Median, USD | Per sqm, THB | Rentals |
|---|---|---|---|---|---|---|
| Bang Tao and Laguna | 486 | 55 | 25,808,750 | 737,393 | 111,952 | 148 |
| Kamala | 61 | 8 | 45,784,900 | 1,308,140 | 143,170 | 2 |
| Layan | 55 | 7 | 22,800,000 | 651,429 | 153,693 | 4 |
| Rawai | 54 | 0 | 7,530,480 | 215,157 | 120,484 | 6 |
| Nai Yang | 31 | 0 | 7,177,000 | 205,057 | 124,219 | 0 |
| Nai Harn | 23 | 0 | 10,500,000 | 300,000 | 101,613 | 2 |
| Surin | 23 | 2 | 8,400,000 | 240,000 | 141,379 | 6 |
| Nai Thon | 21 | 8 | 12,800,000 | 365,714 | 108,856 | 6 |
| Chalong | 15 | 0 | 28,500,000 | 814,286 | 54,878 | 2 |
| Karon | 12 | 0 | 8,430,000 | 240,857 | 165,476 | 0 |
| Kata | 12 | 4 | 5,315,000 | 151,857 | 152,000 | 3 |
| Mai Khao | 11 | 0 | 22,800,000 | 651,429 | 82,593 | 3 |
| Patong | 8 | 4 | 23,982,500 | 685,214 | 170,416 | 0 |
The most revealing line is price per square metre. Patong costs THB 170,416 per metre, Chalong THB 54,878. A 3.11 times gap within an island you can cross by car in an hour.
The explanation is straightforward. In Patong the metre comes inside compact apartments in the zone of maximum tourist footfall, where land is expensive and development dense. In Chalong the metre comes inside a large villa with a plot, away from the beach line. The median property in Chalong is in fact higher: THB 28.5 million against THB 24 million. You are paying for floor area, not for location.

Kamala deserves separate attention. Its median of THB 45.8 million is the highest of any district, yet it holds only 2 active long term rentals. This is a district for owner occupation, not for letting. If you are considering Kamala as a rental investment, the rental market there barely exists.

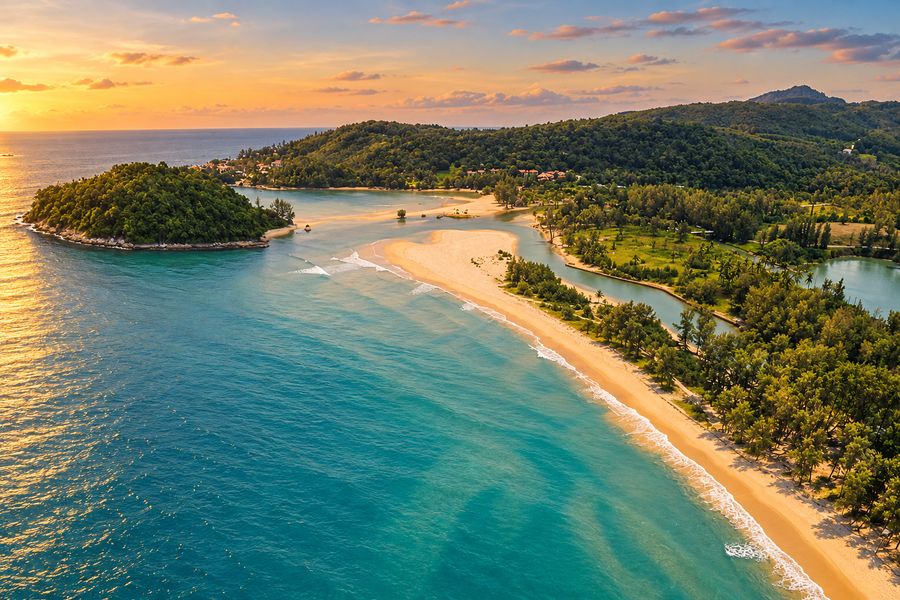
Bang Tao and Laguna is the inverse: 148 active rental listings against 486 for sale. It is the only district on the island where the rental market runs deep enough to calculate yields from statistics rather than from promises.
Yields: apartments beat villas

Yields here are not calculated the common way, and that matters. The usual approach takes the average sale price in a district and divides it by the average rent in the same district. That does not work: the sale pool may be dominated by cheap apartments while the rental pool is dominated by expensive villas, so different goods get compared. Calculated that way, Rawai returns a 31.8 percent yield, which is physically impossible.
The correct approach compares like for like pairs: same district, same property type, same bedroom count. Below are only the pairs with enough properties for a stable median.
| Property | Sample | Median price, THB | Monthly rent, THB | Gross | Net | Payback |
|---|---|---|---|---|---|---|
| Villa 3 bed, Bang Tao | 112 / 30 | 29,000,000 | 200,000 | 8.3% | 5.9% | 17 years |
| Apartment 1 bed, Bang Tao | 70 / 25 | 7,200,000 | 50,000 | 8.3% | 5.9% | 17 years |
| Apartment 2 bed, Bang Tao | 85 / 19 | 13,500,000 | 75,000 | 6.7% | 4.5% | 22 years |
| Villa 4 bed, Bang Tao | 112 / 30 | 45,450,000 | 210,000 | 5.5% | 3.6% | 28 years |
| Apartment 3 bed, Bang Tao | 23 / 6 | 27,100,000 | 120,500 | 5.3% | 3.4% | 30 years |
| Villa 2 bed, Bang Tao | 14 / 13 | 18,250,000 | 60,000 | 3.9% | 2.2% | 45 years |
| Villa 5 bed, Bang Tao | 26 / 6 | 61,750,000 | 145,000 | 2.8% | 1.3% | 76 years |
Net yield is calculated as gross multiplied by 92 percent occupancy (long term letting, roughly 11 months a year), less a 10 percent management fee, less 1 percent of property value per year for common area charges, insurance and minor repairs. Rental income tax is excluded as it depends on the ownership structure. Under conservative assumptions (83 percent occupancy, 15 percent management fee, 1.5 percent costs) net yield falls by roughly 1.5 percentage points.
Two conclusions contradict the conventional view.
First, a one bedroom apartment yields the same as a three bedroom villa. Both deliver 8.3 percent gross. But the entry cost differs fourfold: THB 7.2 million against THB 29 million. The return on each baht invested is the same, but apartments let you enter with a quarter of the capital, or spread the same capital across several units and reduce vacancy risk. If the goal is income rather than occupation, that is a strong argument.
Second, the larger the property, the worse it rents. A five bedroom villa costs THB 61.75 million and earns THB 145,000 a month; a three bedroom villa costs THB 29 million and earns THB 200,000. The larger property costs twice as much and rents for less. The reason is that long term tenants for five bedrooms barely exist: such villas live on short term letting, where the economics differ entirely and occupancy is volatile. Buying a five bedroom villa for long term letting makes no sense.
The truth about guaranteed yields

In Phuket project marketing, a guaranteed yield promise looks like the market norm. In practice it is a narrow segment.
| Developer promise | Active properties |
|---|---|
| 5 percent per year | 8 |
| 6 percent per year | 7 |
| 7 percent per year | 15 |
| 8 percent per year | 1 |
| 10 percent per year | 1 |
| Total | 32 of 831, or 4 percent of the market |
Now compare that with actual performance. One bedroom apartments in Bang Tao return 8.3 percent gross on real market rents. Against that benchmark, a "guaranteed 7 percent" is not an attractive offer.
The mechanism usually works like this: the developer fixes a payout for three to five years and takes the property into its own rental pool. You gain predictability but forfeit all income above the guaranteed level, along with control over how the property is managed. A guarantee does not raise your yield, it caps it in exchange for lower risk. That is a reasonable product for an investor who needs predictable cash flow, and a poor deal for anyone expecting market returns.
It is also worth checking what funds the guarantee. If it is priced into an inflated sale price, you are simply receiving your own money back.
Tourism falls, prices rise: unpacking the contradiction
Q3 produced an apparently contradictory picture.
- Phuket received 9,200,166 visitors in January to August 2026, down 1.76 percent year on year. Foreign arrivals fell 2.52 percent while Thai arrivals rose 0.46 percent. Revenue declined 0.99 percent to THB 356.21 billion. Figures presented by the Tourism Authority of Thailand at the Phuket provincial administration meeting on 28 September 2026.
- Phuket airport passenger arrivals fell 1.4 percent in the first half of 2026, to 4.39 million.
- Meanwhile the southern Thailand residential price index rose 5.59 percent year on year according to the Bank of Thailand. That is the strongest region in the country, against Bangkok at minus 0.18 percent over the same period. Over five years the south has added 20.1 percent.
Fewer tourists, yet prices rising faster than anywhere else in the country. The explanation is that Phuket housing prices have long been driven not by tourist flow but by two other forces.
The first is land. Buildable land in the western coastal districts is constrained by geography: a narrow strip between the mountains and the sea. Housing market research by Sopon Pornchokchai records Phuket land prices rising an average of 7.47 times over the observation period, around 10.7 percent annually, among the highest rates in Thailand. The cost base of any new project rises with land regardless of how many tourists arrived this season.
The second is a shift in buyer type. Russia remains Phuket's largest source market at 619,130 arrivals in January to July, ahead of China at 383,918 and India at 354,066. But the housing market is driven not by tourists but by people relocating long term or buying a second home. That demand is not tied to holiday length.
The supply data supports the scarcity reading. Were the market oversupplied, new supply would be rising and prices under pressure. Instead new supply fell 26 percent while dollar prices held flat. That is the profile of a market constrained by land and construction costs, not one inflated by demand.
One risk deserves attention from landlords. C9 Hotelworks analysts note that the greater danger for Phuket is not falling arrival numbers but shortening average length of stay and a rotation of the guest mix toward lower spending markets. Competition from Vietnamese resorts, Phu Quoc in particular, is intensifying on entry level pricing. For short term rentals this means pressure on low season occupancy.
What was expected of Q3 and what happened
Spring expectations for the Phuket market assumed the development cycle would continue. Here they are against the outcome.
| Expectation for Q3 | Q3 actual | Verdict |
|---|---|---|
| Inventory drifts up to 3,600-3,800 listings | 3,487, up 120 over the quarter | Missed |
| Average sale prices hold flat | THB 28.03M against 27.9M, up 0.5 percent | Correct |
| Gross yields stabilise in a 5-7 percent corridor | Villa 6.3 percent, apartment 8.0 percent, townhouse 4.3 percent | Partly |
| Kamala continues drifting up toward USD 1.6M | Kamala average USD 1.631M | Correct |
| Dispersion between districts widens | Per metre gap widened to 3.11 times | Correct |
This table uses the same basis as the spring forecast: all published listings and average values. That is why it differs from the active-supply medians earlier in the report (for example, a THB 28.03 million average here against THB 34.4 million for active properties), and yields here are averages by property type rather than like-for-like pairs.
The main divergence was the direction of supply. Inventory was expected to keep expanding as development pipelines completed, which read as a moderately bearish signal for owners. The opposite happened: new supply contracted by a quarter, so no oversupply pressure on prices materialised in Q3. Owners of generic units in Patong and Karon have not yet had to soften price expectations by the 5 to 8 percent anticipated in spring.
The 5 to 7 percent yield corridor held for villas, but apartments came in above it at 8 percent: their prices eased slightly over the quarter while rents held.
Q4 2026 forecast with testable criteria
These are stated so the next report can say plainly whether each held.
One. New supply flow stays below 130 properties for the quarter. Basis: the Bang Tao delivery cycle is winding down and no major new starts have been announced in other districts. Test: properties added between 1 October and 31 December.
Two. Bang Tao and Laguna concentration exceeds 58 percent of active supply. Basis: 54 percent of Q3 new supply landed there while six districts added nothing. Test: district share of active supply on 31 December.
Three. Median active property price stays within THB 20-23 million. Basis: average prices have not moved for two quarters, and tight supply is offset by soft tourism. Test: median across active properties on 31 December.
Four. The per square metre gap between the most and least expensive district exceeds 3.2 times. Basis: widening dispersion is now confirmed for a third consecutive quarter.
High season opens in November and typically lifts transaction activity, but it has little effect on supply: decisions to launch new projects are taken a year in advance.
Methodology
The internal data source is the InDreams Phuket catalogue as of 30 September 2026: 831 active sale listings and 1,353 rentals across 13 districts. The sample reflects the inventory and deal flow of a single agency with an office in Bang Tao on Lagoon Road rather than the aggregate Phuket market, and where district samples are small this is flagged directly in the text.
Key methodological decisions:
- Active supply means published sale listings with no sold flag and a stated price. This is the sample used wherever current market conditions are described.
- Quarter on quarter comparison uses all published listings, including sold ones, without which the trend would not be comparable. Those tables are labelled.
- Median rather than average describes the typical property. The average is shown alongside to expose the skew.
- Yields are calculated only on like for like pairs: same district, same type, same bedroom count, with a minimum of 14 properties for sale and 6 for rent. Pairs with smaller samples were excluded, because a median built on three or four properties is unstable and produces unreliable results.
- Exchange rate is taken at THB 35 to the dollar.
- External data is attributed: Tourism Authority of Thailand, Bank of Thailand, Airports of Thailand, CBRE, C9 Hotelworks.
The methodology is set out in detail so every figure in this report can be checked and reproduced: on the Phuket market, discrepancies between sources usually come not from different data but from different counting methods.
What to do with this data
If you are buying to live, budget against the median rather than the average. The widest choice and almost all new supply are now in Bang Tao and Laguna: six districts added no new properties this quarter, and choice there is shrinking.
If you are buying to let, calculate yields on comparable properties within a specific district, and check whether a rental market exists there at all. An expensive district does not imply high rents. Bang Tao and Laguna is the only district where 148 rental listings let you base yields on statistics: one-bed apartments here return 8.3 percent gross from THB 7.2 million.
To test a specific property or budget against the numbers in this report, message an InDreams manager: we will match comparable options in Bang Tao and Laguna and show the actual rental history.
Current listings are in the Phuket property for sale section, with villas and apartments listed separately. To assess rental potential, see houses for rent and apartments for rent.
The next Phuket market report is due in early January 2027 and will include a verdict on the four forecasts set out above.